CS 161 ‐ Graphing Results
Creating a Chart in Google Sheets
-
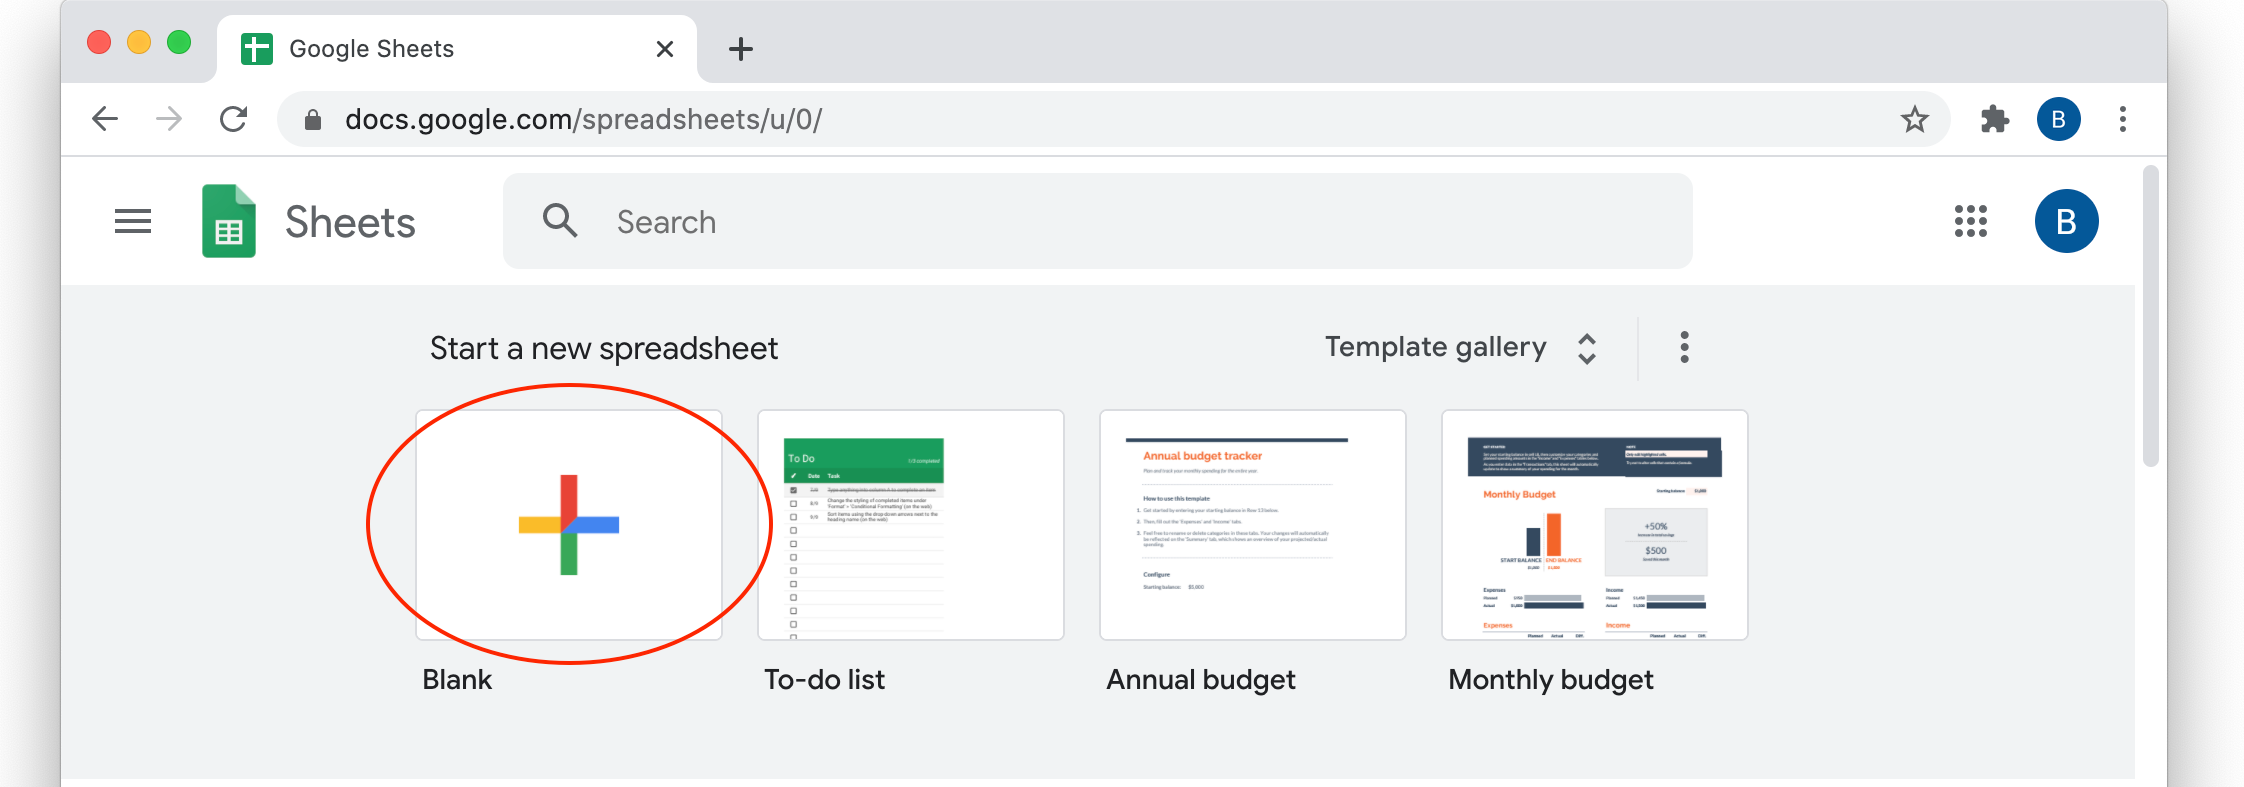
Start by going to https://docs.google.com/spreadsheets. You'll need to login to a Google account, but you can use your Puget Sound login credentials if you don't have a personal Google account. You should see a page that looks like this:
-
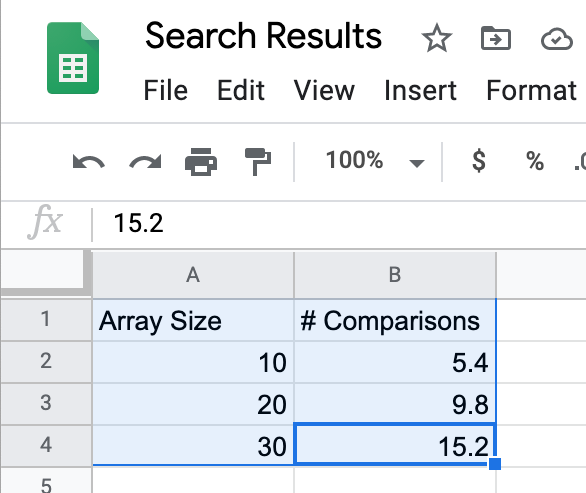
Click on the + to create a new blank spreadsheet document. (Circled in red on the image above.) Once the new spreadsheet is created, enter your data, with column headers at the top. As mentioned on the lab writeup, you can copy and paste from BlueJ's output window to the Google sheet if you format the print statements so they print the array size, a tab character ("\t"), and the average number of comparisons. Below I'm showing just three rows, but you should have lots more.
-
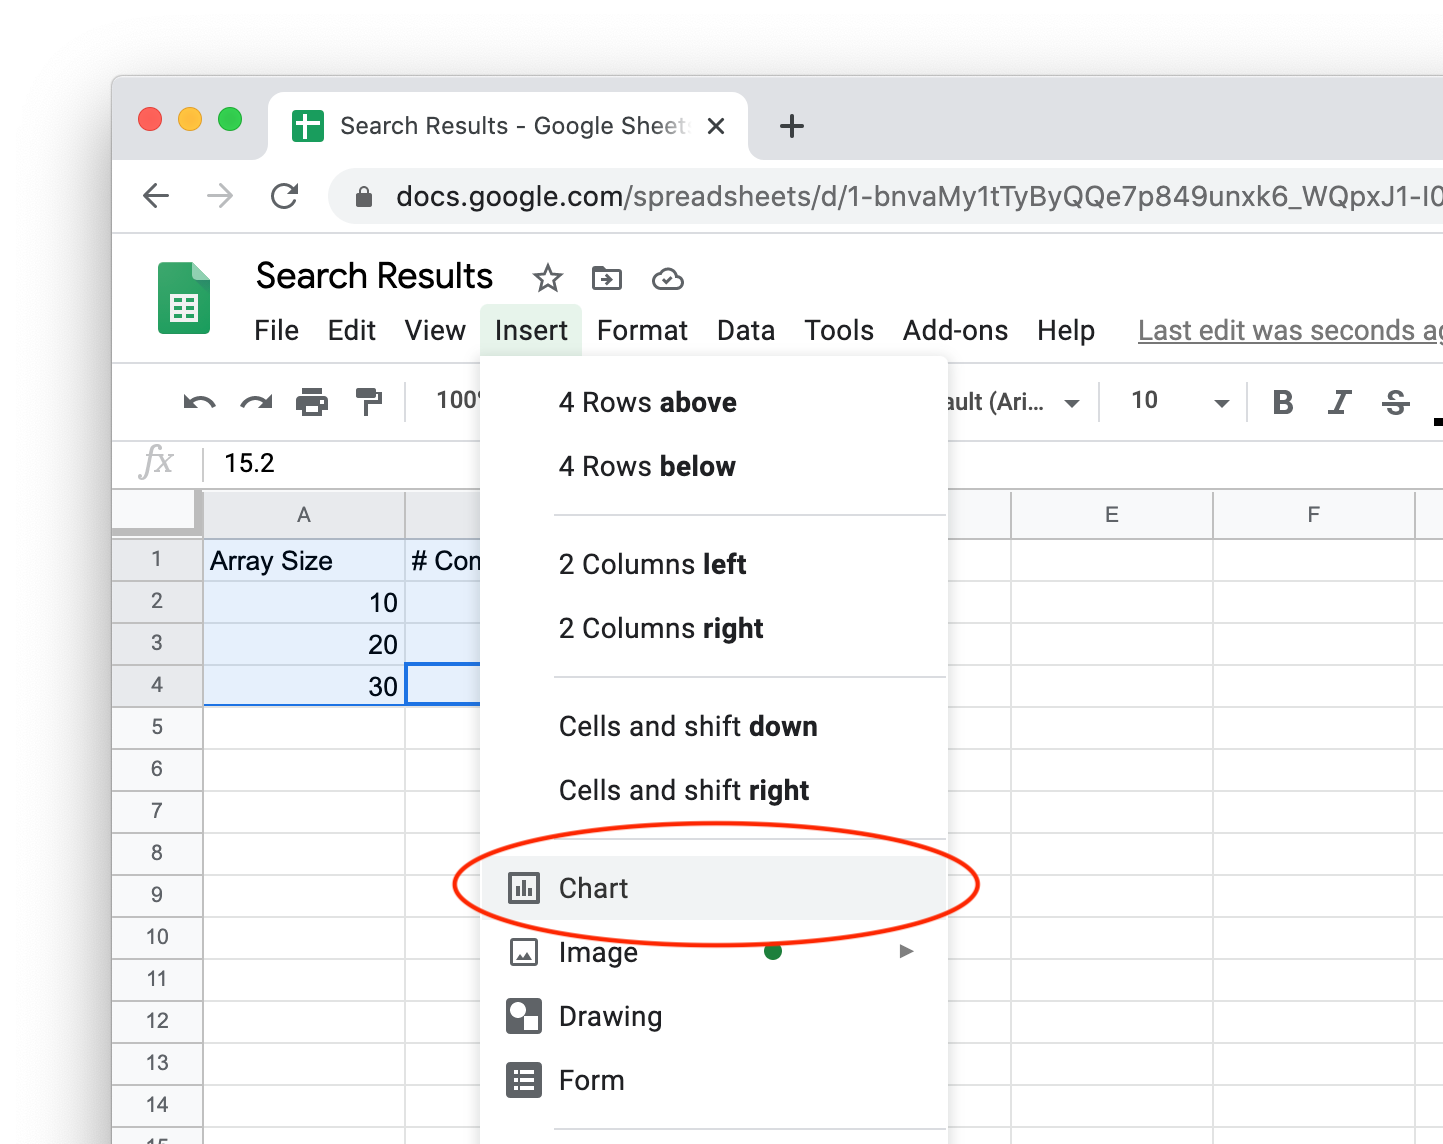
Once your data has been entered, select it all (including the headers), go to the "Insert" menu, and select "Chart" as shown below.
-
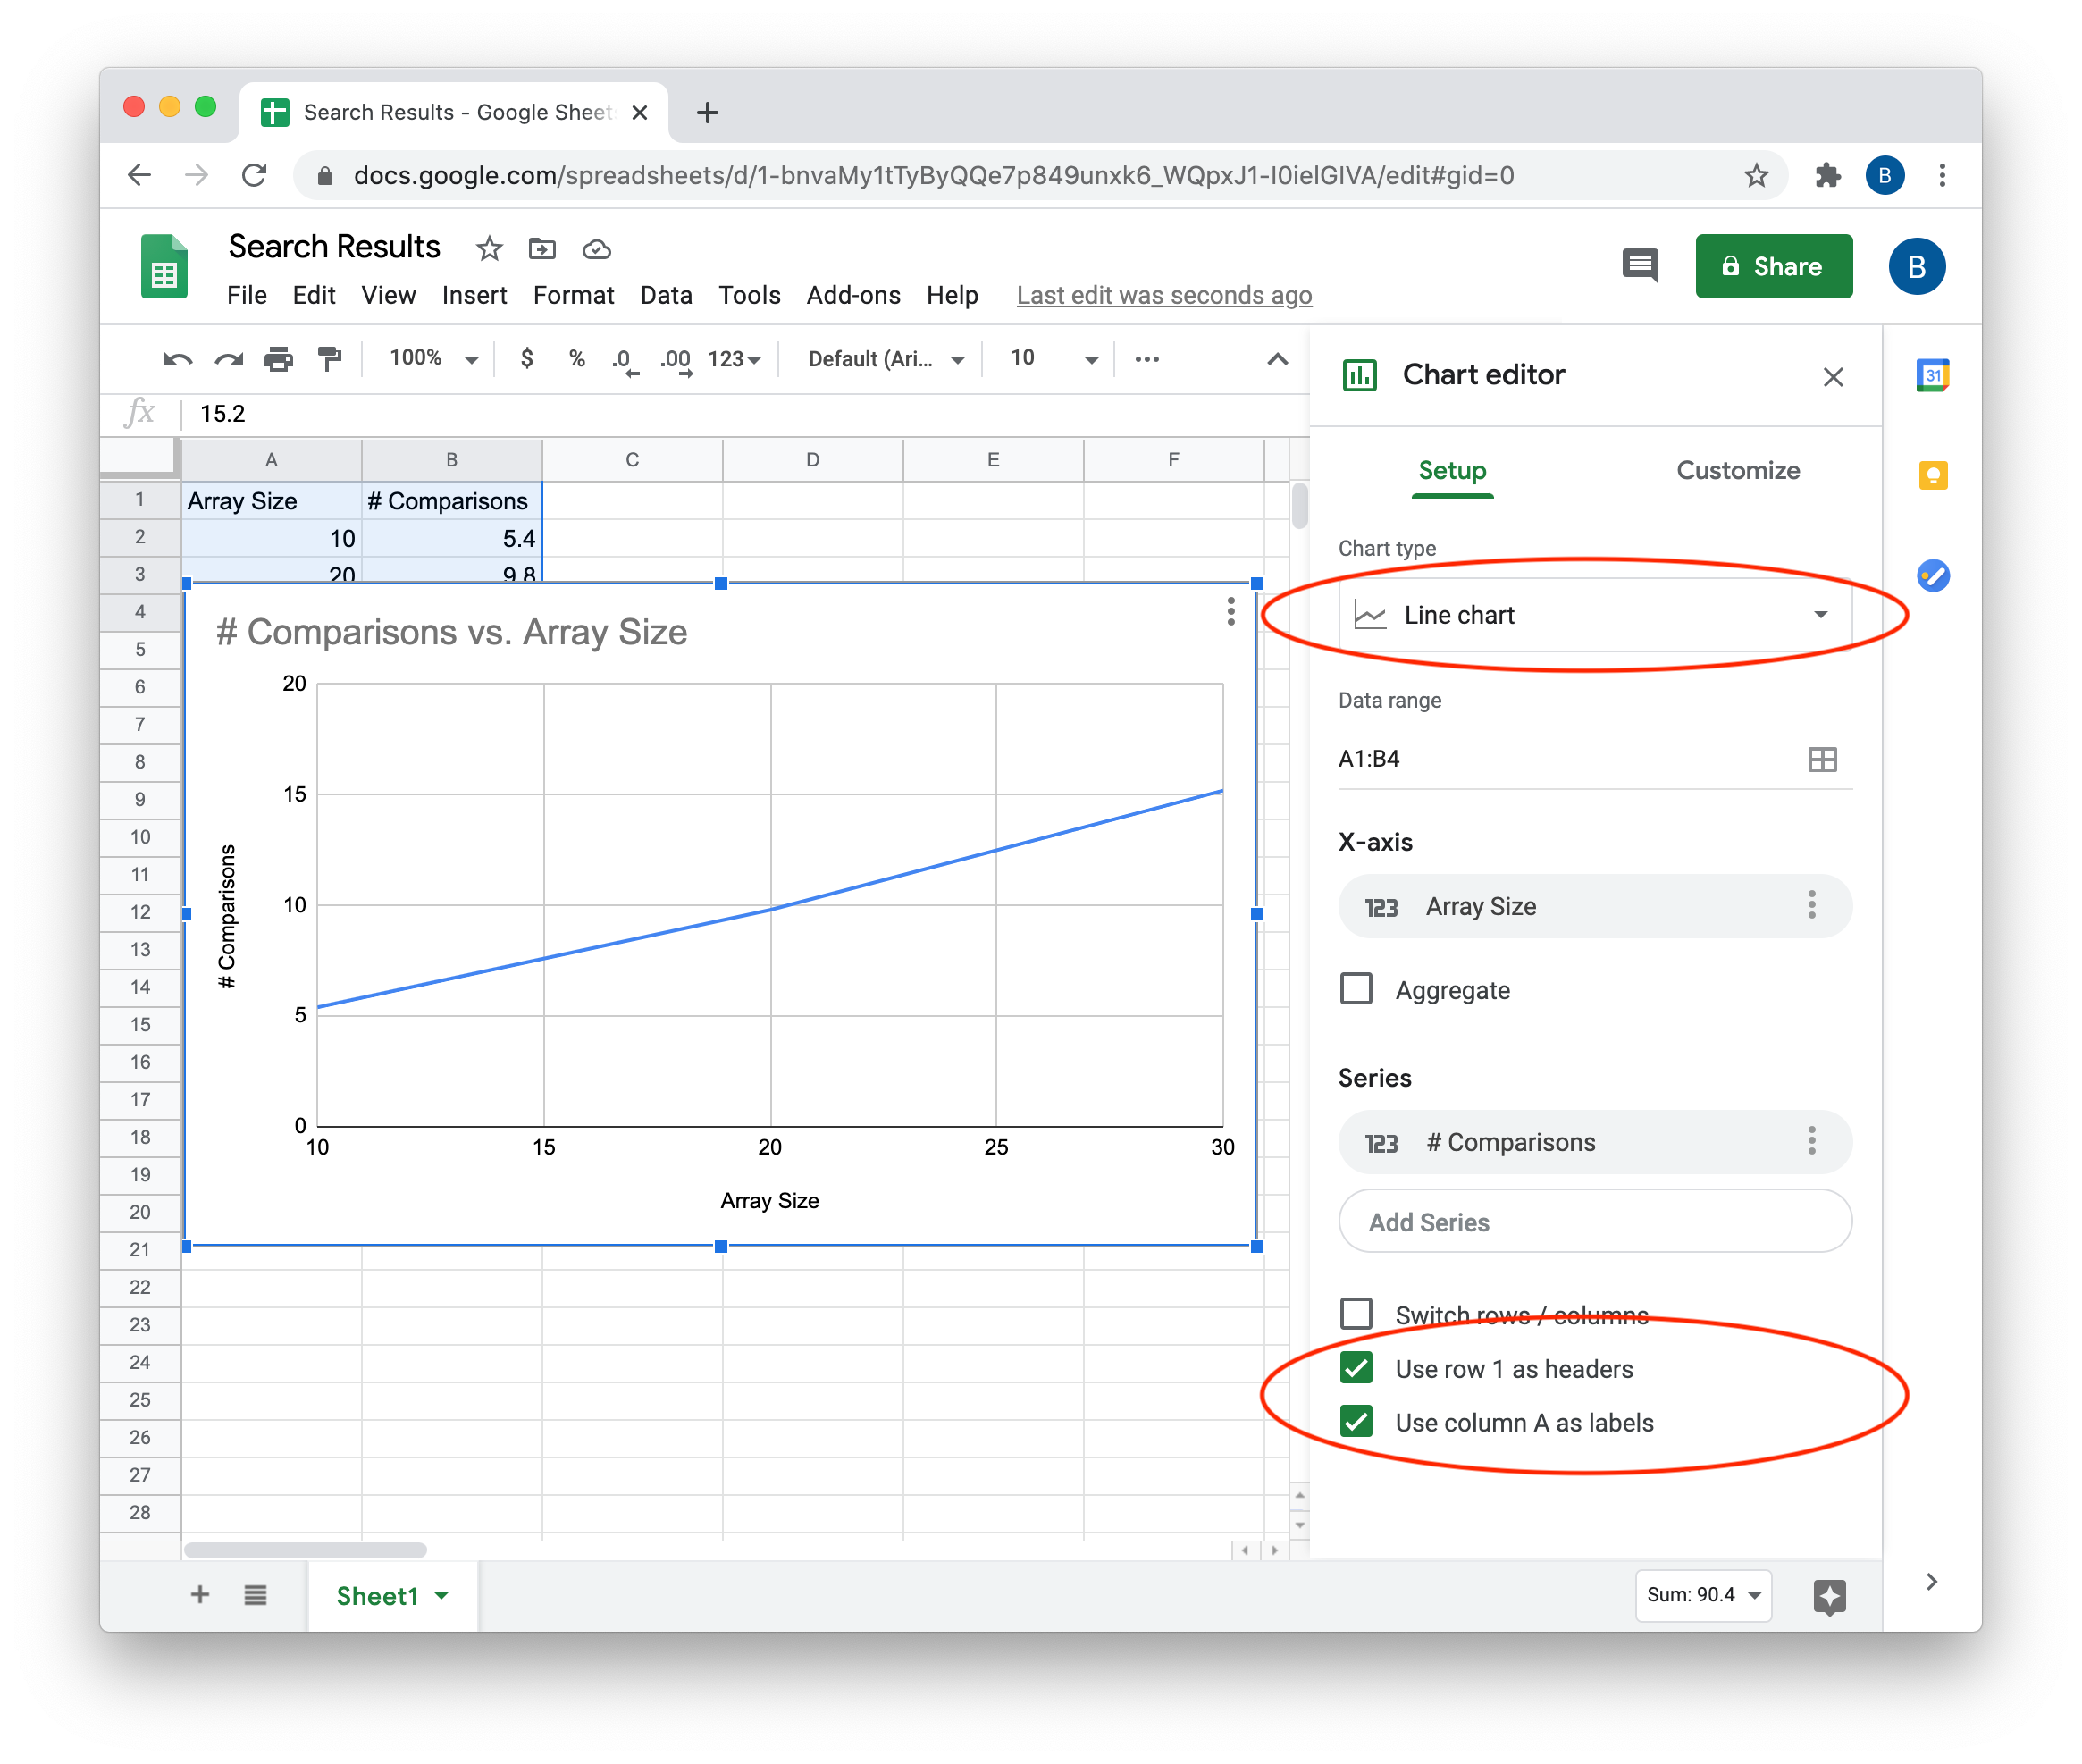
After the chart is created, make sure it's using "Line chart", and that the two boxes at the bottom are checked. The chart image should start to look like the one below, though with lots more data points. Once the chart is created, you can drag it around so it doesn't cover the data if you want.
Brad Richards, 2022